- 10x Trading Strategy
- Posts
- Chart Book: Bitcoin
👇1-5) Rumors are circulating that the U.S. Marshals Service may sell 69,000 Bitcoins valued at $6.5 billion. Until this development is clarified, Bitcoin is likely to remain under pressure. As we pointed out, this adds to downside risks driven by a hawkish macroeconomic environment and declining U.S.-denominated liquidity.
👇2-5) Technical indicators point to further challenges ahead. The monthly chart shows a shooting star formation, signaling a potential top in December, with monthly support at $72,715. Weekly support is at $80,283, but given Bitcoin's rapid rise from $68,000 to $96,000 post the US Presidential election in just three weeks, there is limited support between these levels (if $91,300 is broken).
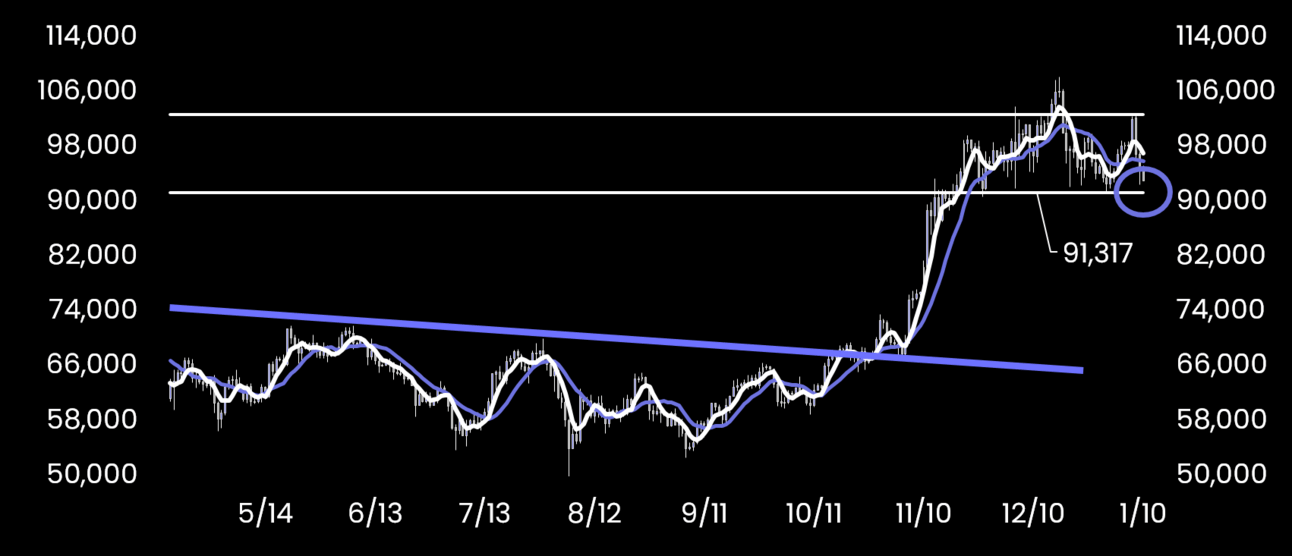
👇3-5) The 20-day low at $91,317 is critical to watch in the short term. A break below this level could accelerate the downside move. Additionally, weekly reversal indicators remain at elevated (overbought) levels, suggesting it may take weeks to reach a tradable bottom.
👇4-5) With the daily trend model breaking below $93,000, locking in some profits may be prudent to mitigate risks. This remains the same message we shared in our Bitcoin Chart Book on December 30, which holds true today.
👇5-5) Please find the two most important charts below and our Bitcoin Chart Book attached (link below).
Bitcoin’s 20-day low at $91,300 is critical.
Bitcoin’s trend model has turned bearish (bullish on Sep 18 at $62,000)

|
